SLOs and alerting: how to stop paging people for nothing
Why most monitoring setups produce noise instead of signal, how to pick service level objectives that reflect user experience, and what an alert should actually mean.
By Hardik Kamdar
Ask an on-call engineer how many of last month’s pages required them to do something. If the honest answer is under half, the monitoring is not working, regardless of how many dashboards exist.
Alert fatigue is not a discipline problem. It is a design problem, and it has a predictable cause: alerting on causes instead of symptoms.
Alert on symptoms, not causes
Most monitoring starts from what is easy to measure. CPU, memory, disk, queue depth. So the first alerts are thresholds on those: page if CPU exceeds eighty percent.
The trouble is that high CPU is not a problem. It is sometimes a sign of one, and often a sign of a service doing its job efficiently. Meanwhile a service can be completely broken at low CPU, and nothing fires.
The better question is what your users would notice. Requests failing. Requests taking too long. Data arriving late. Those are symptoms, and they are worth waking someone for because they are true regardless of the underlying cause.
Cause metrics still matter, for diagnosis. CPU, connection pool saturation, garbage collection pauses: all valuable once you are investigating. They belong on dashboards, not on the pager.
What an SLO actually is
A service level objective is a target for a symptom metric, expressed over a window.
“Ninety-nine point nine percent of requests to the checkout API return successfully within four hundred milliseconds, measured over thirty days.” That is an SLO. It names what you measure, what counts as good, and over what period.
The useful part is the inverse. A 99.9 percent target over thirty days permits roughly forty-three minutes of failure. That is your error budget, and it turns reliability into something you can reason about rather than a preference for things not to break.
If you have consumed a fifth of the budget in three days, something is wrong and worth escalating. If you have used almost none of it in six months, you are probably over-engineering reliability at the expense of shipping. Both are decisions the budget makes visible.
Pick targets you can defend
The instinct is to pick a high number. Someone suggests four nines and it sounds appropriately serious.
Four nines is roughly four minutes of downtime a month. That constrains architecture, deployment strategy and on-call structure considerably, and it costs real money. It is the right target for a payment authorisation path and an absurd one for an internal reporting dashboard.
Work backwards from consequences. What happens if this is unavailable for five minutes? For an hour? For a working day? For a lot of internal tooling the honest answer is that people wait, and 99.5 percent is generous. For a checkout path, minutes cost revenue directly.
Setting a target you cannot meet is worse than setting a modest one. Once the budget is permanently exhausted it stops informing anything, and the team learns to ignore it.
Thresholds from your own traffic
Alert thresholds copied from a default or picked because they are round numbers will be wrong for your system.
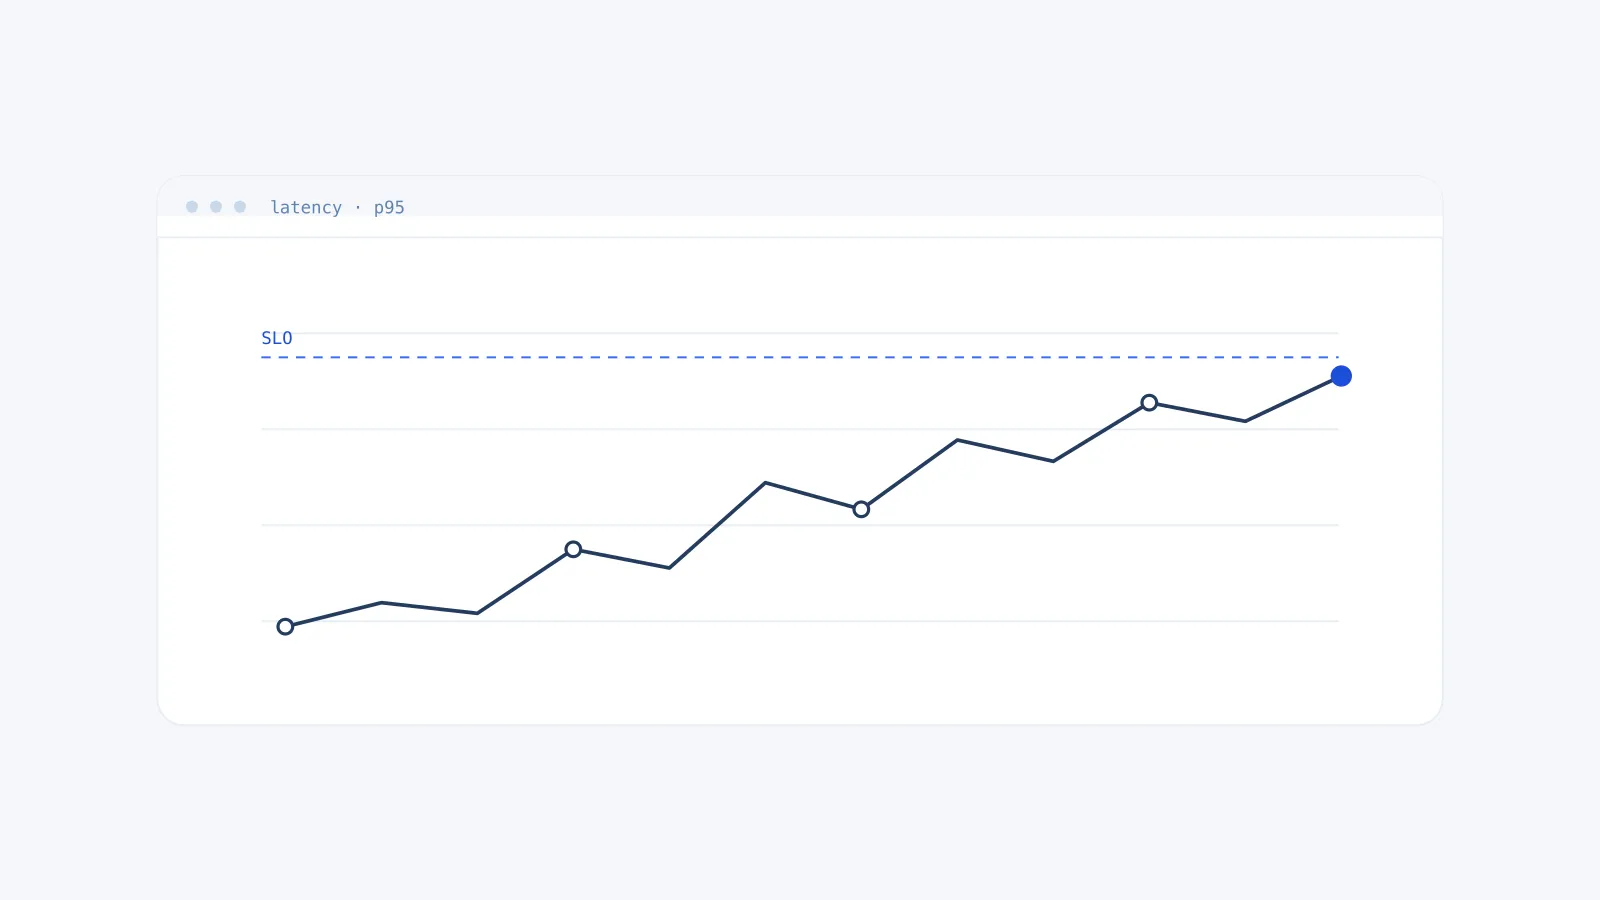
Look at the distribution. If your p95 latency normally sits at two hundred milliseconds and occasionally touches three hundred during a nightly batch, an alert at two hundred and fifty will fire every night and teach everyone to ignore it. Set it where a human genuinely needs to look.
Alert on rate of change as well as absolute values. Error rate climbing from nought point one percent to two percent is a strong signal even though two percent might be within a generous SLO, because that trajectory usually continues.
Use burn rate rather than instantaneous breach. Consuming the monthly error budget in an hour deserves a page. Consuming it slowly over three weeks deserves a ticket. Same total, different urgency, and burn-rate alerting distinguishes them.
Automate the responses that are already known
Some failures have a known safe remedy. A pod failing its health check gets restarted. An unhealthy instance gets replaced. A queue backing up gets more consumers.
If the response is deterministic and safe, automate it and do not page anyone. Every one of those handled automatically is an incident that never happened. Log it, count it, review the trend, but do not wake someone to run a command a machine could run.
Reserve pages for the situations that need judgement. That is the whole point of the distinction.
Give the responder context automatically
When a page does fire, the responder should not start from a blank page.
The alert should say which SLO is affected, how much budget is burning, what changed recently, and link straight to the relevant dashboard and runbook. Recent deploys are the single most useful piece of context, because most incidents follow a change.
An alert that says “high error rate on api-gateway” and nothing else costs the responder ten minutes of orientation before they can begin. That ten minutes is entirely avoidable and it is spent during the worst part of the incident.
Then actually close the loop
Every significant incident should produce concrete follow-ups: a missing alert, an unclear runbook, a fragile dependency, an automation that should have existed. Blameless, written down, and tracked to completion.
The tracking is the part that gets skipped, and it is the part that matters. An incident you do not learn from is one you have scheduled to happen again.
If your pager is noisy and you want help sorting signal from noise, that is a large part of what we do.